← Projects

Emissions data an auditor can trace

Every emissions number here starts as a PDF from a supplier. I built one extraction pattern that turns those invoices into figures traceable back to the document they came from: electricity for Scope 2, industrial gas for Scope 1.

It worked perfectly the first time I ran it. The second time, it would have deleted the three years of invoices it had just saved, and reported success.

My role
Builder Tester Analyst
Source data
PDF tax invoices on SharePoint
Built with
01

Extract

I built it for the easy supplier first. The second one is where it had to earn its keep.

Supplier one Electricity: the template

One known invoice layout (two minor historical variants), one file per billing period. A manifest tracks what has already been processed; every run downloads only new or changed PDFs, extracts the billing text, pulls the fields, and appends fact rows. Skip logic first, extraction second, so a rerun with nothing new touches nothing.

Supplier two Gas: the real test

The second supplier's folder is not a folder of gas invoices. It is a folder of everything the supplier has ever sent: sales invoices, monthly rental invoices, credit adjustment notes, purchase orders, statements. Four different invoice layouts mixed in among them.

A pipeline that assumes every PDF in the folder is an invoice breaks the first time it hits a credit note. This one doesn't assume that.

The design decision that mattered: classify by the document's actual extracted text, never by filename. Filenames are inconsistent; text is not. Every document is routed to one of three outcomes: parse as an invoice, skip as non-target, or flag for review, and even the ones it skips are recorded in the manifest, so a purchase order doesn't get re-read and re-rejected on every single run, forever.

One batch: 120 PDFs in, 112 real invoices correctly classified and parsed, 8 correctly skipped, 0 needing manual review.

The second supplier is where a pattern proves itself. Anyone can build a script that reads one layout. The question is what happens when the folder isn't clean.
02

Validate

My first version worked. That was the problem: the next run would have thrown away everything the first one saved.

Each run's "new or changed files" filter is supposed to be narrow: that is the entire point of incremental processing. The defect was in what happened next.

Finding one The overwrite

The step that builds the master data file only ever saw the current run's rows. Thirteen existing invoices on file, two new PDFs arrive, the filter correctly narrows to those two, and the upload step took those two rows and used them as the entire file. Not appended. Replaced. Thirteen invoices of history gone, and the pipeline would have reported success, because from its own point of view it had succeeded.

Finding two The disguise

A second, sharper fault made this worse before it made it visible. A metadata-restore step was wired to the pre-filter file list instead of the post-filter one, so the two new files briefly carried stale identifiers left over from the full list. That made them look like updates to existing rows, not new rows: a wrong number with no visible seam, exactly the kind of failure that survives a casual glance.

The fix, in one sentence: never write only what the current run produced; always load what already exists, merge, then write the full result. Applied to both the master data file and its own processing manifest.

Not a lucky catch. I wrote the test to force this exact failure, because quietly losing history is what incremental pipelines do.

Thirteen existing invoices on file. Two duplicated under new file identities, to simulate two new PDFs arriving. Run the pipeline and check what survives:

  • Expected: 13 existing + 2 new = 15 rows, 13 unique documents.
  • Before the fix: 13 existing + 2 new produced 13 rows: the two new rows had overwritten everything.
  • After the fix: 15 rows, correct.

A dashboard reading “13 invoices” after that first version would not have looked broken. It would have looked like a report that simply started three years later than it should have, and nothing about that number announces itself as wrong.

A crash tells you something is wrong. A quietly overwritten history file does not. It just answers the next question with less than it should know.
03

Report

I don't publish a number more precisely than I know it. Some of these factors are still provisional, and the model says which ones.

Once the extraction is trustworthy, the emissions calculation has its own honesty requirement: not every line item in a gas invoice is a Scope 1 emission.

The gas supplier sells argon, oxygen and nitrogen alongside genuinely reactive gases. Argon and nitrogen are inert; oxygen supports combustion but isn't itself the emission source. All three are correctly zeroed. Acetylene and the mixed shielding-gas products are the ones that count, calculated against a published methodology (energy content combined with CO₂, CH₄ and N₂O factors).

Where the number isn't fully known yet, the pipeline says so instead of guessing: the shielding-gas factor is explicitly tagged as a temporary proxy, pending supplier composition data in the lookup table, using the same interim methodology as acetylene, flagged as provisional until the real figure is confirmed. It is not presented as more precise than it is.

Reconciliation, built in, not bolted on: the pipeline's line-item detail and its invoice-level summary are checked against each other on every batch: the same total, arrived at by two independently derived paths. On the batch shown here, both agreed to two decimal places.

In production, the report reads two clean fact tables in Power BI (one per supplier, joined to a shared date dimension) with no re-derivation of emissions inside the report itself. If a factor is ever wrong, it gets fixed once, at the source, not chased through a dozen measures.

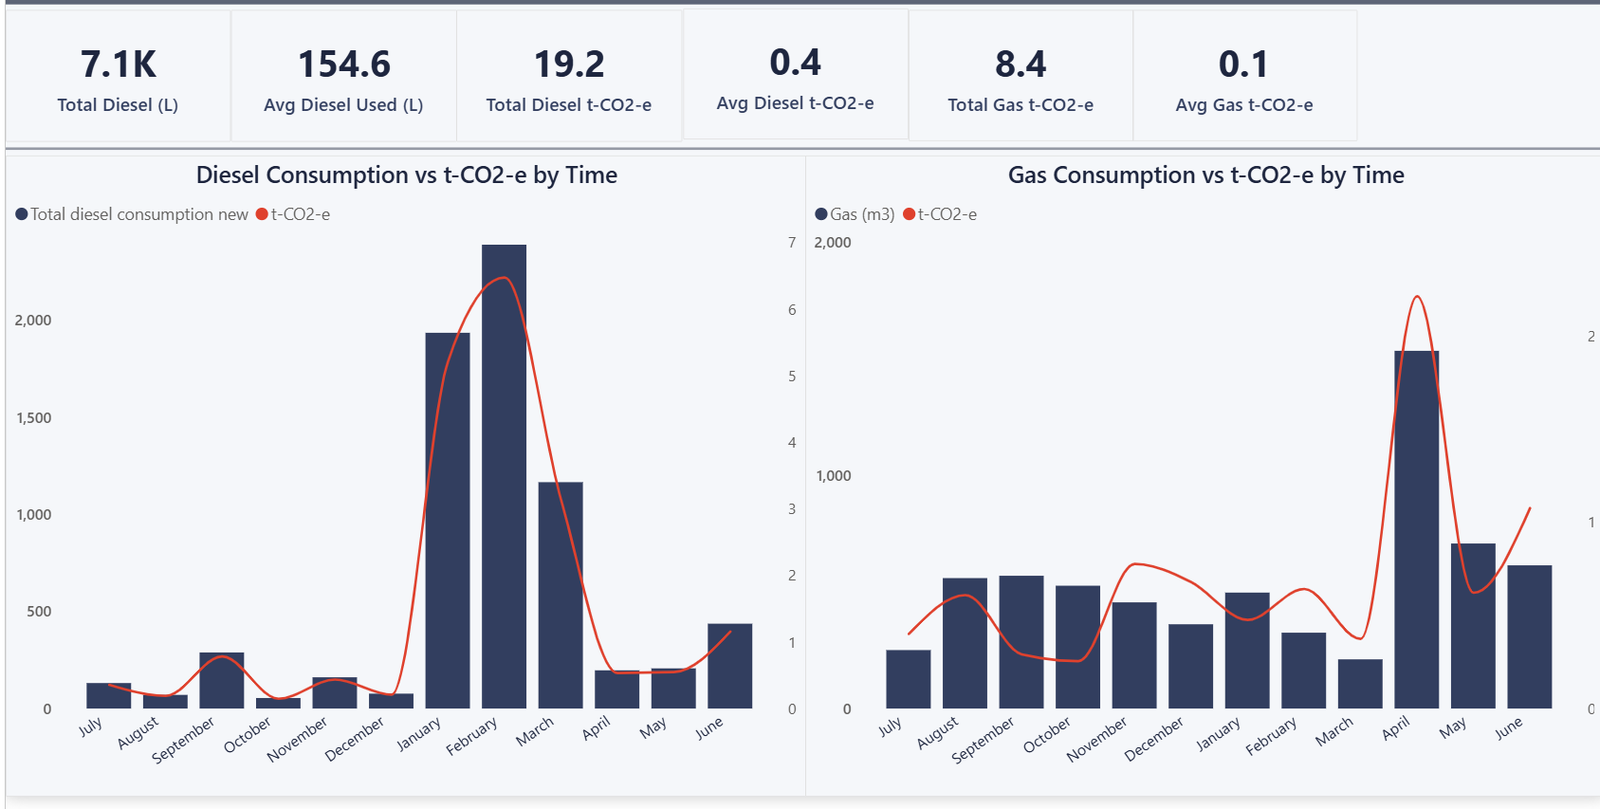
Power BI Scope 1 dashboard: total and average diesel litres and gas m3 converted to t-CO2-e, with monthly trend charts for diesel and gas consumption against emissions across a full financial year.
Scope 1: consumption and t‑CO₂-e, side by side, month by month. Every bar traces back to an invoice; every invoice traces back to a source PDF.
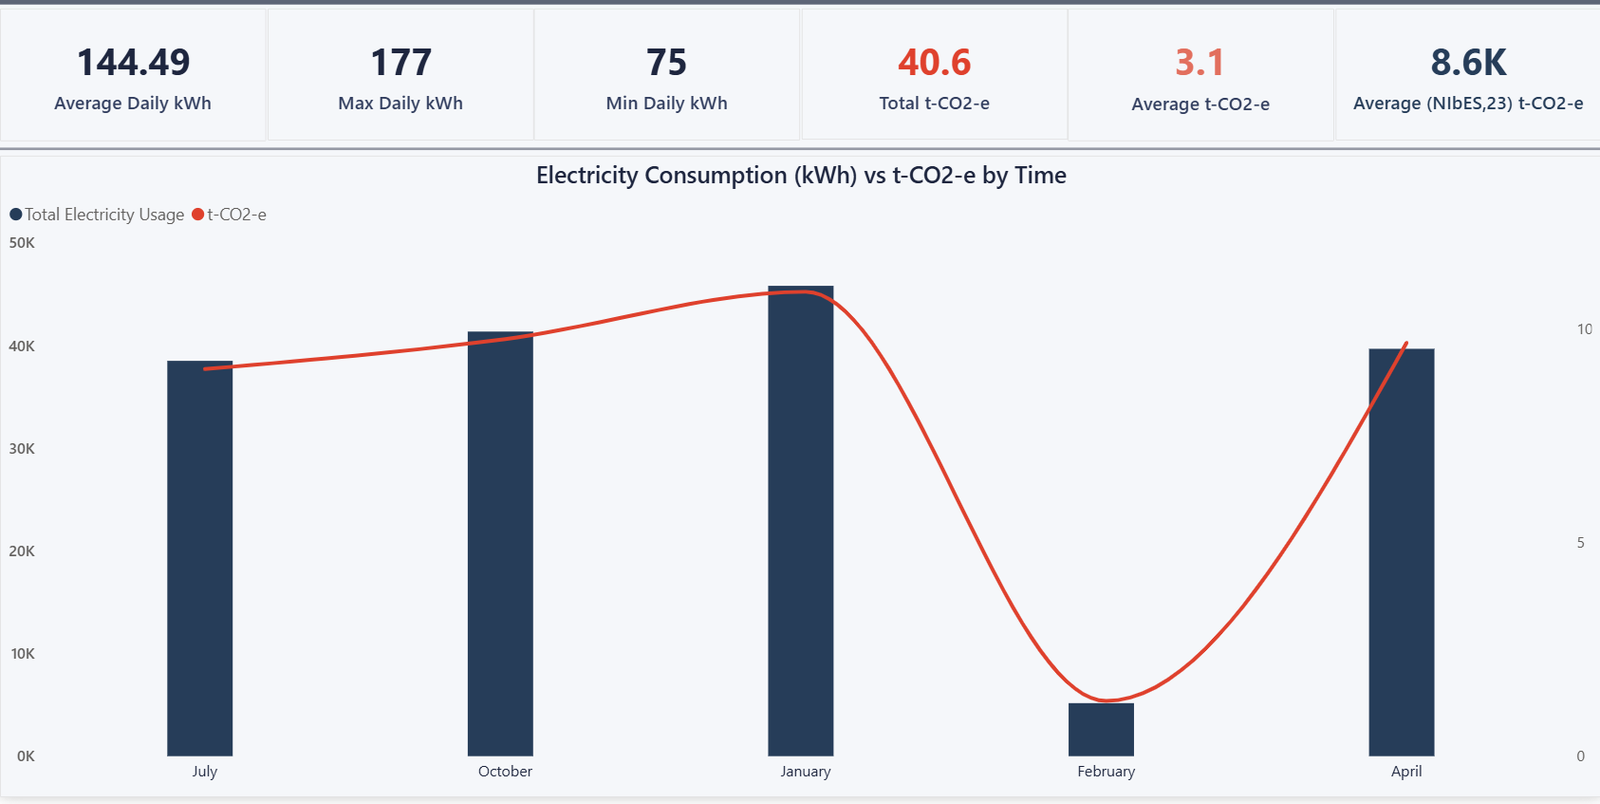
Power BI Scope 2 dashboard: average, maximum and minimum daily electricity kWh converted to t-CO2-e, with a monthly trend chart of electricity consumption against emissions.
Scope 2: electricity consumption against t‑CO₂-e, with the state grid factor built into the calculation rather than assumed constant.
120→112 PDFs classified, only the real invoices parsed
4 invoice layouts handled inside one mixed folder
13→2 rows the first version would have left standing
2 independent totals reconciled to the same figure

What the design assumes

  • This covers electricity and gas only. Fleet fuel is a separate, currently manual thread: a colleague extracts it from a supplier web portal, because no API access exists yet. Not claimed here.
  • The gas emissions factor for shielding-gas products is a temporary proxy, not a confirmed figure. It is labelled as such in the data model, not silently treated as final.
  • Deletion isn't detected. If a source PDF is removed from SharePoint, the pipeline doesn't know to remove its row. Same limitation on both suppliers; cleanup today is a full rebuild, not an automatic reconciliation.
  • The classification rules are layout-specific. A supplier changing its invoice template needs the parser updated; the pipeline flags this itself, rather than silently mis-parsing, by routing anything it doesn't recognise to manual review instead of guessing.

What I'd do differently

  • Write the incremental test before the incremental feature, not after. The overwrite defect existed because nothing forced a second run to happen before the pipeline went live. It should have been the first test written, not a later one.
  • Build the same classify-by-text approach into the first supplier too, even though it didn't need it yet. The second supplier needed it on day one of that build; better to have the safety net a batch early than a batch late.
  • Treat a provisional emissions factor as a tracked task, not a comment in a lookup table. It is correct today because it is labelled; it stays correct only if someone is accountable for closing it out.

I built one pattern and proved it twice. The second supplier's files were never going to cooperate, and the test I wrote to break my own work found a defect that would have quietly erased three years of invoice history. It runs on a schedule now, checks its totals two independent ways, and says so when a number isn't fully known.

The work I want is exactly this: the part where a number has to survive being asked “how do you know?” a second time.

Get in touch

I can walk through the classification logic, the incremental-processing defect, or the test I built to catch it before it reached production.

Adelaide, South Australia · ACST (UTC+9:30)